


In an impressive display of fractal analysis precision, a recent case study correctly anticipated the dramatic reversal on Meta stock following its 20-day green streak, a record not only for the individual stock, but for any Nasdaq-100 firm since 1990.
The Fractal Warning Signs
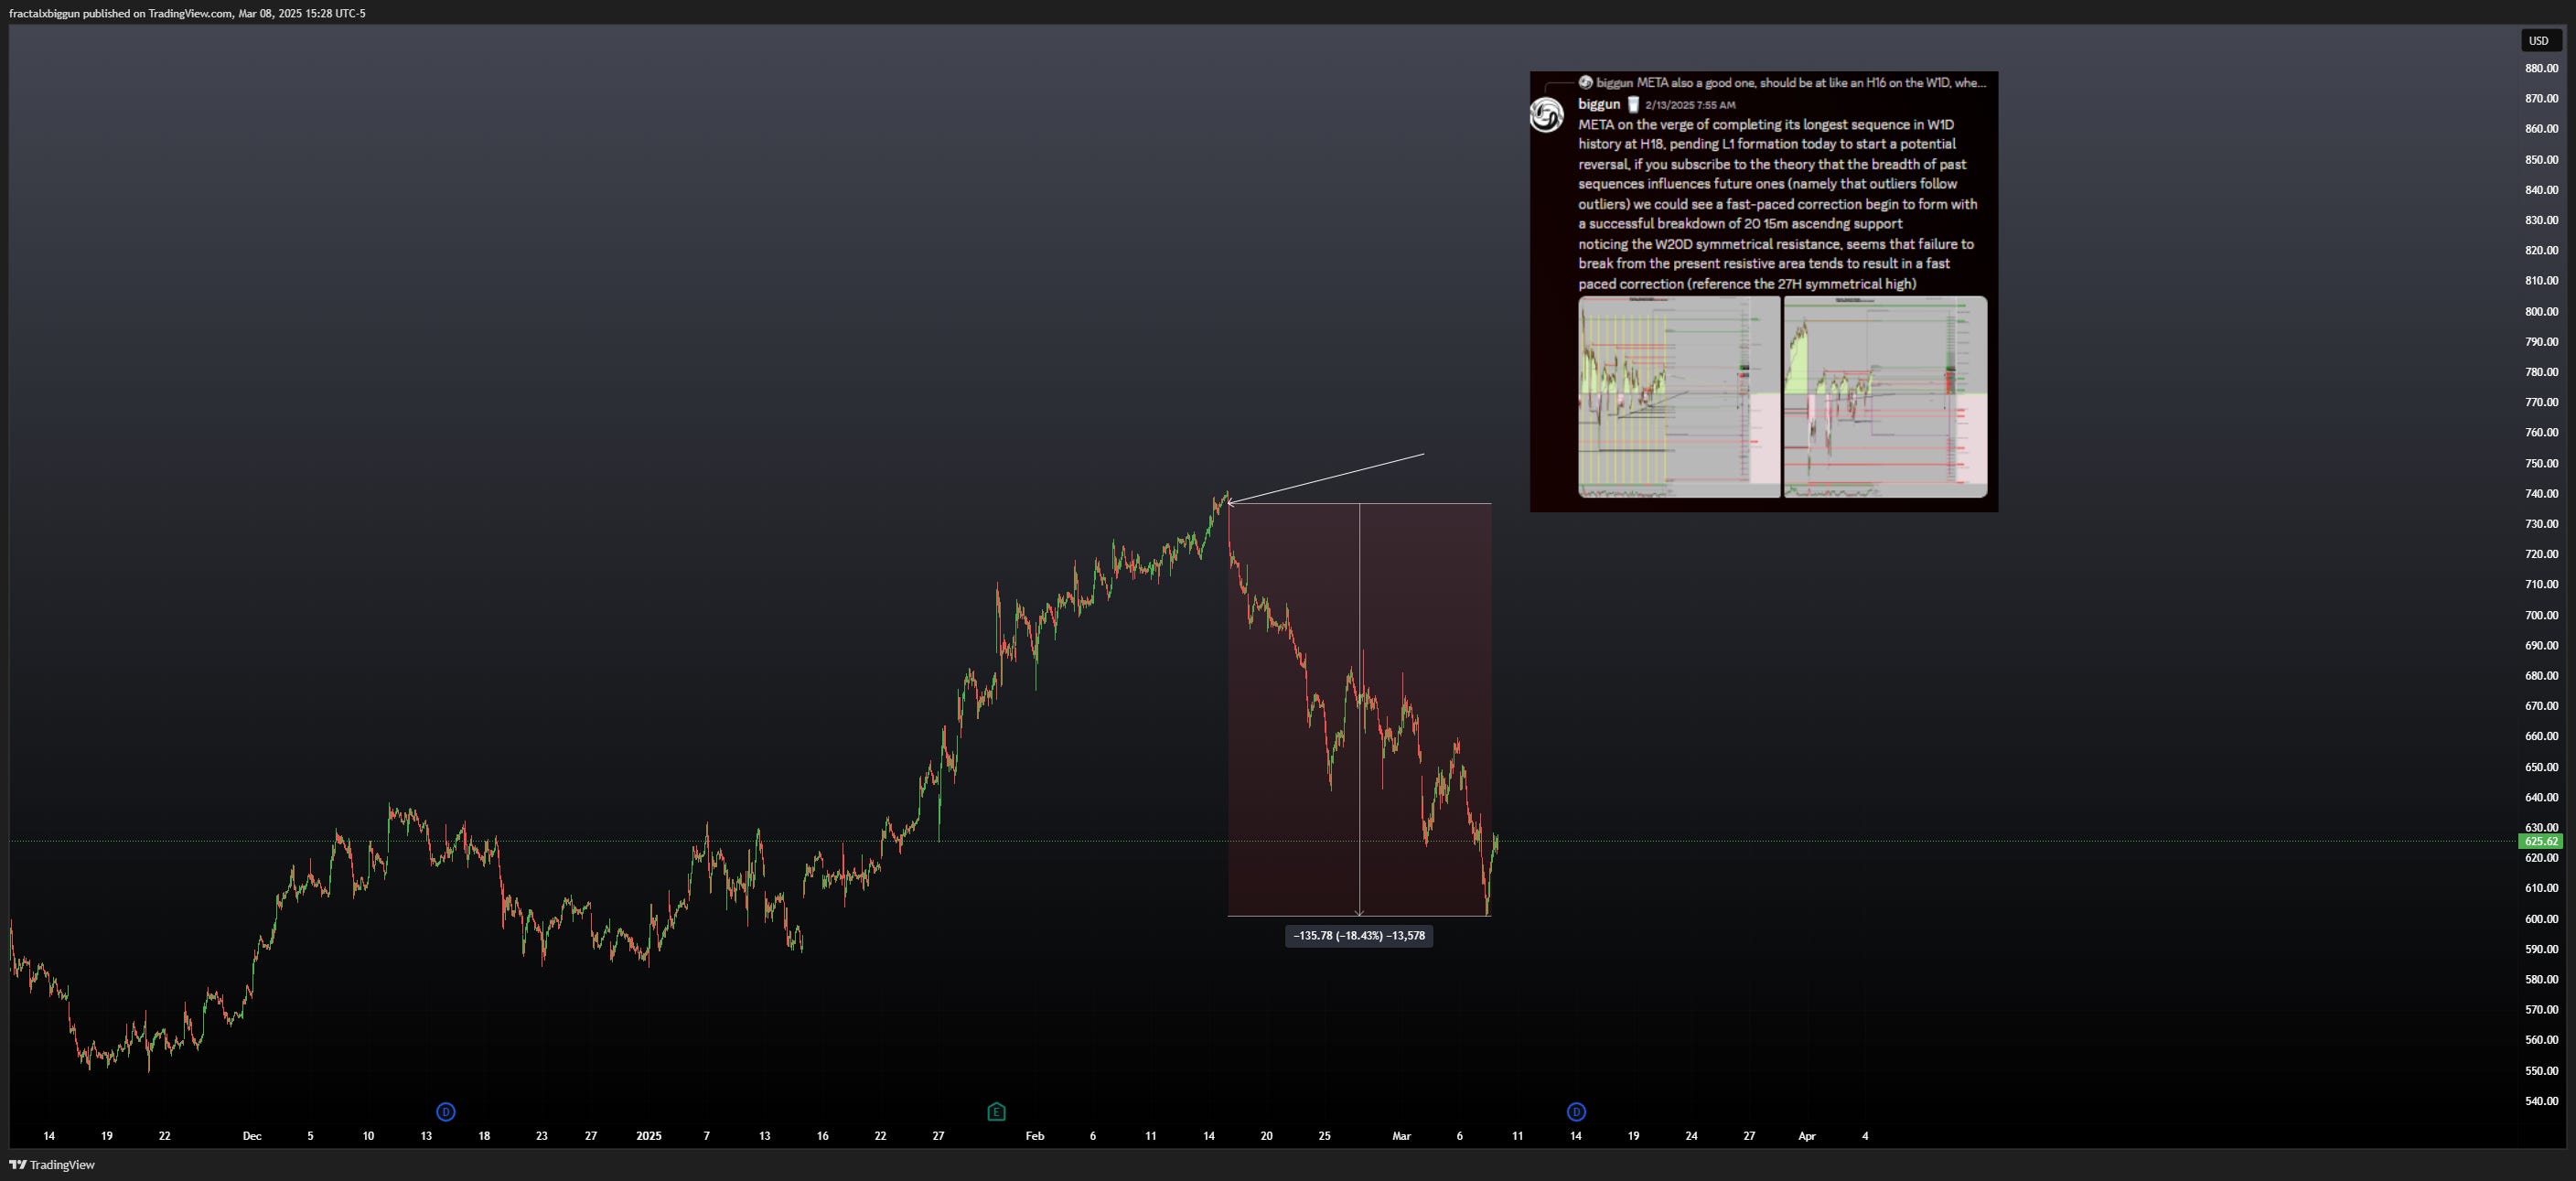
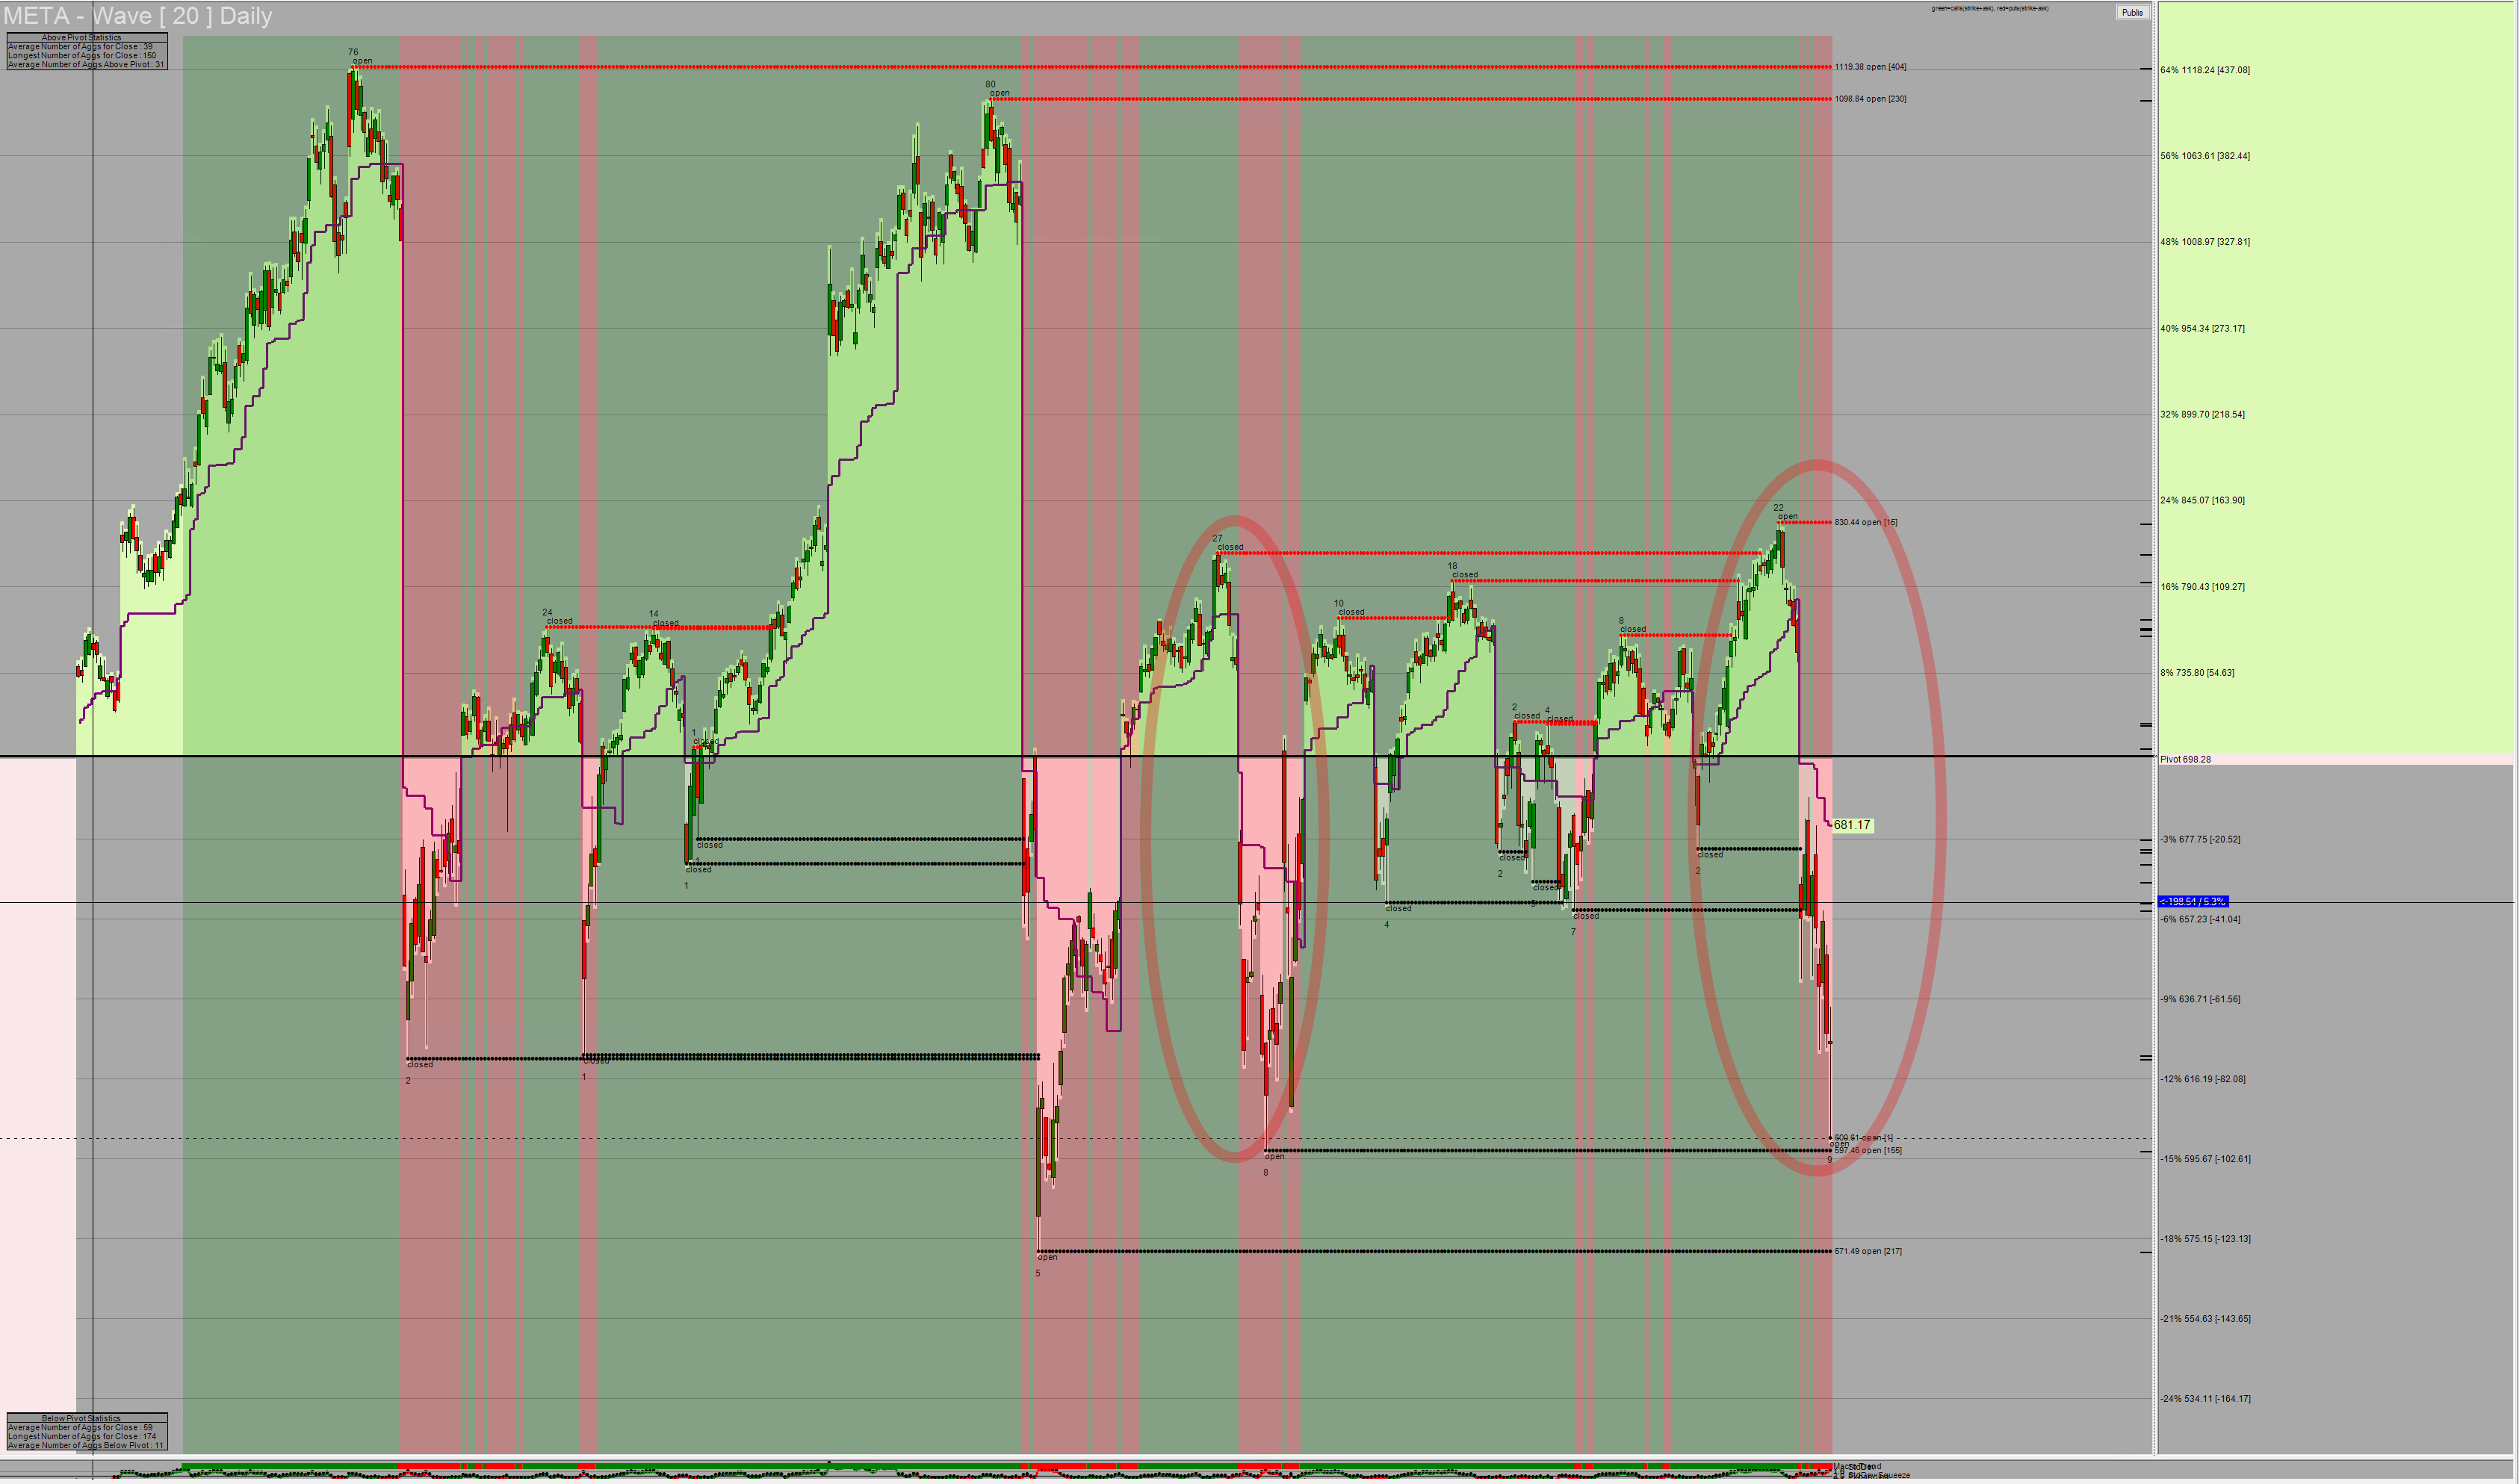
On February 13, we identified critical fractal patterns suggesting META 0.00%↑ was primed for an imminent correction. The original analysis highlighted a specific reference sequence at the past 27H on the Wave20 Daily chart (marked with a red circle).
What made this prediction particularly remarkable was the striking similarity between the pace and breadth of the current sequence compared to the reference pattern. The analysis correctly anticipated that the present sequence would extend for 8 days below the pivot point, precisely targeting the -15% open state cluster (past L8 vs present L9).
Options Chain Data Confirmed the Prediction
Adding further credibility to this forecast was the convergence with options chain data. The Spread Monster IV analysis revealed market participants were actively hedging against a statistically-outlier downside move across multiple options chains—a clear sign that institutional participants were preparing for the correction that fractal analysis had already identified, despite the seductive headlines.
What Did the Headlines Say?
As reported by Yahoo Finance, Meta Platforms Inc. experienced a "record-breaking, 20-day rally" that generated rumors of a potential stock split. Meanwhile, Business Insider noted that Meta had achieved "a 16-day win streak, the longest for any major tech stock in decades," with the company gaining an impressive 17% during this period—the longest winning streak for a Nasdaq 100 firm since 1990.
This extraordinary momentum, ascribed by investor enthusiasm for Meta's AI initiatives, created exactly the type of market euphoria that fractal analysis is designed to cut through.
Conclusion: Read Beyond the Headlines
This META case study reveals the predictive power of fractal analysis in financial markets. While mainstream financial media focused on Meta's historic winning streak and AI-driven momentum, the underlying fractal patterns were already signaling an imminent reversal. The precision with which this correction materialized—targeting specific price levels within the anticipated timeframe—demonstrates the mathematical foundations of market movements that often remain invisible to conventional analysis. Fractal physics provides a framework for understanding market structure beyond headlines & outdated linear chart pareidolia, allowing traders to identify critical turning points when momentum appears strongest. The convergence of these fractal signals with options flow data further validates this approach as an effective method for navigating complex market conditions. For investors seeking to develop a more nuanced understanding of market dynamics, fractal analysis offers a compelling alternative to momentum-based strategies, as evidenced by its accurate anticipation of META's significant reversal following a record-breaking positive sequence.